The Delta Variant is shaking up the data tree. "New Science" is the latest terminology. Prior to this I guess we were trusting the "Old Science". The challenge for a data hungry person like me is the constant disappointment. Florida as an example - they stopped doing a daily COVID-19 dashboard preferring to defer to the CDC stating they send the data to them daily. Unfortuanately clicking on the state of Florida sends me right back to the Florida Department of Health - an infinite non data loop.
One could argue that weekly data is sufficient and 7 day moving averages are better statistical viewing and takes some of the "data noise" out of the clamor. J.D. gave an interesting perspective of why Israel, England and Canada might have better and more transparent data. National Health Care (Centralized) provides a greater and more standardized way of capturing and accumulating data. So my criticism of the CDC should be tempered. Fair Point!
Since deaths (an hospitalizations) have dropped dramatically I discovered some great interactive data tools and visualization on the CDC Data Tracker site.
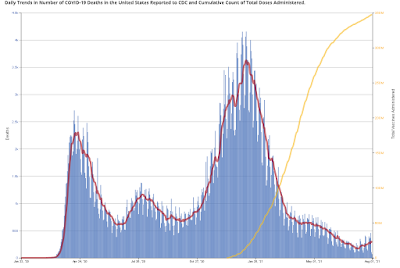
I thought it would be interesting to visualize the deaths supperimposed on the total vaccines administered. Looking at this graph in simple terms and you would say WOW .... this vaccine caused the dramatic fall in deaths!!! And that is exactly as the media is reporting. The clinical trials are "proven" out in the population as a whole.But
The dates from January 7, 2021 to January 13, 2021 had several peaks -
Daily Deaths peaked 4,154 on 1/13/21
7 Day Average Deaths 3,626 on 1/13/21
New Positive Cases 295,881 on 1/7/21
7 Day Average Cases 253,378 on 1/11/21
Here are the cumulative numbers by 1/13/21
Total Positive Cases - 23,502,741
Total Deaths - 413,899
Total Vaccines Administered (1 or 2 shots) - 15,167,141
BUT WAIT..... Look at this chart - it looks similar!
Let's call the new yellow line in this chart "the ultimate vaccine". It coincidentally crosses very near the upper chart - on January 25, 2021.
You ask - what is that "ultimate vaccine" the one that has also caused the dramatic reduction in deaths?
The yellow line is the cumulative positive cases of COVID-19 - 25,170,494 survivors - presumably with ANTIBODIES.
Use a multiple of asympotmatic cases of 3-5 and you get 75 to 125 million people with antibodies. I can find no data that "proves" immunity and/or no further transmission but there may be a high probability that is also why cases of Alpha Variant were rapidly decreasing also.
What is my point? We have lost control! There are no control cases. We are using the unvaccinated (which includes survivors with antibodies) as a improper control group compared to the vaccinated (which also includes survivors with antibodies). In fact the clinical trials were unblinded without proper control groups to measure going forward.
Now the Delta Variant and others appear - no control there either. We are "flying blind" in a vaccine airplane mixed passengers that we have no clue about their immunity or antibodies.
Addendum: While I'm critical of the State of Florida for ceasing the daily data. I was humbled to see that state had weekly
Serology Data (as of May 31). Why did this stop?


No comments:
Post a Comment