Thursday, April 30, 2020

Normal Numbers Nonsense?

The discussion (sometimes called argument) continues about whether COVID-19 is anymore serious that the normal flu.  Everyone is second guessing each state's Governor's response, the Federal Government's response and comparing our death rate to other countries responses to this pandemic.  J.P. even asked what level of deaths in the U.S. would justify praise for the state and federal response?

The real underlying issue is what is a pandemic?   History provides some clue to this answer.  Start with what is considered the 5-6 Worst Pandemics in History .

(1) The Bubonic Plague/Black Death 1347- 1351 75-200 million deaths worldwide
(2) Spanish Flu (H1N1) -  1918-1919 50 million worldwide deaths (675,000 USA)
(3) Asian Flu  (H2N2) - 1957  1.1 million worldwide deaths (116,000 USA)
(4) Hong Kong Flu (H3N2) - 1968  1 million worldwide deaths (100,000 USA)
(5) Swine Flu (H1N1) - 2009-2010  575,400 worldwide deaths (12,469 USA)
(6) HIV/AIDS -  1980 - 2006  25 million deaths worldwide (still in process)

The Worldometer Coronavirus daily count is now at 233,686 worldwide deaths and 63,765 in USA so by the numbers it may surpass the #4 and #3 in absolute numbers. 

But the absolute numbers are still flawed in revealing a solution.   For example:  The Spanish Flu, which lasted 36 months, in it's first wave (Jan 1918 - October 1918)  killed 200,000 people in the USA (about 0.194% of the 103 million population). The estimated infected population was 1/3 so the actual mortality rate for the first wave was about 0.582%.   Presented in a percentage that number seems no different from the seasonal flu.  This numbers nonsense is used to criticize the shelter-in-place actions (either soft or hard).

A recent RedState article was sent to me "If Wuhan Virus Is SoBad, Why Are Deaths So Low?" that attempted to justify why "There is really no medical reason to pursue this nonsense." The data looks legitimate sourcing from the CDC, yet a quick check on the actual site of Vital Statistics shows quite a different picture.

https://www.cdc.gov/nchs/nvss/vsrr/COVID19/
After lengthy conversation with P.N.,  I gave up trying to use numbers to convince him that this crisis is approaching the severity of the Spanish Flu and is well beyond the mortality numbers of a normal flu season in the USA.  Finally we both agreed that based on today's nonsensical numbers that by year end deaths in the USA could approach 100K - 120K.

It just shows that normal - is in whatever numbers make you feel normal.  And that's the definition of  nonsense - predicting deaths that we call "normal levels".


Tuesday, April 28, 2020

Lessons of History

"Those who cannot learn from History are doomed to repeat it"  was stated by George Santayana and ironically lived during the Spanish Flu and was from Spain (the country that inherited the name for the tragic Spanish Flu that likely started in Kansas).


I think the country (and possibly the world) might be experiencing deja vu on this COVID-19 pandemic.   Read some of the quotes from the Smithsonian article about the Spanish Flu:


By July [1918] it didn’t seem to matter. As a U.S. Army medical bulletin reported from France, the “epidemic is about at an end...and has been throughout of a benign type.” A British medical journal stated flatly that influenza “has completely disappeared.”

SEPT 1918 The second wave had begun. -  Across the country, public officials were lying. U.S. Surgeon General Rupert Blue said, “There is no cause for alarm if precautions are observed.” New York City’s public health director declared “other bronchial diseases and not the so-called Spanish influenza...[caused] the illness of the majority of persons who were reported ill with influenza.” The Los Angeles public health chief said, “If ordinary precautions are observed there is no cause for alarm.” Now the head of the Army’s communicable disease division, he jotted down his private fear: “If the epidemic continues its mathematical rate of acceleration, civilization could easily disappear...from the face of the earth within a matter of a few more weeks.”  Then, as suddenly as it came, influenza seemed to disappear. It had burned through the available fuel in a given community. An undercurrent of unease remained, but aided by the euphoria accompanying the end of the war, traffic returned to streets, schools and businesses reopened, society returned to normal.
A third wave followed in January 1919, ending in the spring. This was lethal by any standard except the second wave ……   After that third wave, the 1918 virus did not go away, but it did lose its extraordinary lethality, partly because many human immune systems now recognized it and partly because it lost the ability to easily invade the lungs. No longer a bloodthirsty murderer, it evolved into a seasonal influenza.  Another question concerns who died. Even though the death toll was historic, most people who were infected by the pandemic virus survived; in the developed world, the overall mortality was about 2 percent

Looking further into the politics of the time, the political fight over entry into WW I preceded the virus and I'm sure Woodrow Wilson became distained for his actions at that time (both War and Pandemic).   

J.P. wondered what level of deaths in the US would justify praise for the state and federal response?  Until the election is over, and we are out of economic hardship, the cacophony of BOTH praise and criticism will be deafening.  Once that time fades in our memory, it will be sounds of silence with another lesson of history forgotten for a more enlightened generation to ignore.  

Jesus Christ could have come down and halted the virus on Easter and there would still be critics saying he arrived on the scene late :)


Tuesday, April 21, 2020

Virtual Castaway

At 3pm yesterday my mental alarm clock and calendar went off.  I had totally "spaced out" a Zoom meeting that I was to lead at 7pm.   The Shelter in Place has put my life and routine in the Twilight Zone.  I can even remember how many days I have been isolated as a castaway.  Like a prisoner, maybe I should start a daily hash mark on the wall. I started distancing in my office March 9 but transferred to home shelter in place March 24 and haven't been outside my neighborhood more than three times. 

The debate continues about death rates, proper ways to resume business, who's to blame, immediate health risks, and the extent of long term emotional, physical and financial damage. Pressure is building on all fronts.

Call it a "sick" bet but I finally bet a lunch with P.N. on the mortality percentage of estimated COVID-19 infections on November 4th (the day of elections).  This crisis has put a great emphasis on death - an inevitable result for all of us.  Naturally the human instinct is to extend life as long as feasible, and our compassion is demonstrated in our attempts to curtail premature death in others. 

Of the 57million deaths worldwide 54% can be attributed to the top 10 causes: 


Based on this chart - 3 million are lower respiratory infections (Influenza; pneumonia).   Also this chart varies dramatically based on developed countries and undeveloped countries.

The macro view of humanity is to understand how to allocate economic resources to slow the rate of death for the greatest number of individuals (a utilitarian philosophy).   However, the individual personal decision comes down to the selfish motive of extending your life with family and friends.  

The tragedy of this crisis is the inability to be near those you love who are dying. No one wants to die alone!   As virtual castaways, how can we be near those we love who are dying?  -  only one way.  The same way to extend life beyond this world.

Monday, April 6, 2020

Micro vs Macro Views

Some might title the micro view of this crisis "Looking out for #1" ( like the 70's book by Robert Ringer) - it all comes down to "How will the COVID-19 affect me and my family?

For two weeks I've been looking through the rear view mirror at COVID-19 data (Worldwide, USA and State). Even trying to forecast the traffic pattern and peak rush hour risk in the future (with limited success).  But how do you predict what's happening on the local road you are traveling on?  How can you predict how many cars are on YOUR local road and how many are on the road miles ahead of your present position?   More cars are entering the road hourly, more probability of collision with the chance of major accident with possible fatal outcomes.

That took me to the Seattle and King County road map.  Why not see what happened there where the first car entered the USA highway network.

I was amazed at the quality of the Seattle and King County Public Health site and Coronavirus Dashboard:

As a Statistician, I know it is dangerous to pick one data point especially since at least 55 of the cases and 20 of the deaths in King County are related to one physical site - Life Care Center of Kirkland.  This instance makes up almost 10% of the County Deaths all of which were probably residents over the age of 80.   But even with that outlier this data is worth reviewing.

Here are my observations  (rounded for convenience):
(1)  87% of those tested  are Negative
(2) Number of tests per day is about 1K
(3) While the compounded growth rate since the first instance (2/28) to April 4 is 29%, the daily percentage increase was about 4% for April 4th.
(4) More Men than Women test Positive  (W-11%;  M-16%)
(5)You don't want to be 80+ in age (Death % of Positive Cases = 24%)
(7) Best to be under 60  0.8% (Death % of Positive Cases)
(8) Better to be female that male (W-8% Death; M-6% Death)

When looking at the micro view - the fear depends on your age and sex (also pre-existing health issues as reported elsewhere). Now suddenly the potential solutions become more individualized.

The micro view would focus on individual quarantine and age and health based physical/social distancing or shelter-in-place.  This might be a ramp-up strategy for restarting the US economy.

Whether micro of macro, the actions to take will be an experiment we will all have to live with and learn from for future outbreaks.

Macro vs Micro Views

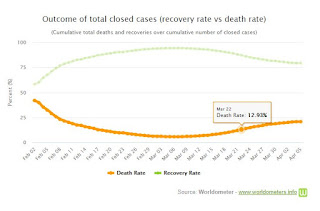
Two weeks ago, I posted the data I felt was most meaningful - outcomes only- recovery and deaths. The March 22 Death rate % of closed cases was 12.93%

The new Death Rate (April 5th) on closed cases is 20.78%. Not good. 

Yet the debate in the USA polarized by an election year continues to rage about what actions on a local, state and federal level should be taken to mitigate the virus impact on human life and economic hardship.

I have even flip flopped emotionally on the cost/benefit of the various lockdowns.   My opinion toggles between looking at the data from a macro view (lock it down) to the micro view (let the youth go free).

Today's blog is the Macro view.  I have compiled the comparison of 5 countries - USA, Italy, Germany, China and S. Korea for the inflow and death outflow.
The two line charts of logarithmic and the desired view is the flattening of the curve (meaning the growth rate stops).  China's line goes almost completely flat (somewhere at 30-40 days) and S. Korea has a very minor slope (after 15-20 days).  Not so good a picture for USA, Italy and Germany well past the 30 days and growing.

The macro/global view would favor locking down the country using Federal control until the curve flattens and deaths level out.  This benefits not only the country involved but provides containment within a country and favors an international containment strategy.

However the micro view (wait for a subsequent blog) favors a more liberal view and focuses on just the threatened age group and those with pre-existing conditions.